About this package
primer.data provides the data used in Preceptor’s Primer for Bayesian Data Science and for the associated tutorials.
Loading
After installing the package, it loads as any package should.
library(tidyverse)
library(primer.data)

qscores
#> # A tibble: 748 × 9
#>    name        department number term  enrollment hours rating instructor female
#>    <chr>       <chr>      <chr>  <chr>      <int> <dbl>  <dbl> <chr>       <dbl>
#>  1 Introducti… AFRAMER    100Y   2019…         49   2.6    4.2 Jesse McC…      0
#>  2 American D… AFRAMER    123Z   2019…         49   3.6    4.4 Cornel We…      0
#>  3 Urban Ineq… AFRAMER    125X   2019…         40   5.2    4.5 Elizabeth…      1
#>  4 Richard Wr… AFRAMER    130X   2019…         23   7.2    4.4 Glenda Ca…      1
#>  5 19th centu… AFRAMER    131Y   2019…         20   3.5    4.9 Linda Cha…      1
#>  6 Social Rev… AFRAMER    199X   2019…         19   7.2    4.8 Alejandro…      0
#>  7 Martin Lut… AFRAMER    199Y   2019…         40   4.2    4.7 Brandon M…      0
#>  8 Elementary… AFRIKAAN   AB     2019…         22   2.9    4.9 John M Mu…      0
#>  9 Elementary… JAMAICAN   AB     2019…         18   1.5    4.9 John M Mu…      0
#> 10 Elementary… WSTAFRCN   AB     2019…         29   2.6    4   John M Mu…      0
#> # ℹ 738 more rows
Using the data
Once the library is loaded and you have confirmed that it can be accessed in your local environment, the data sets can be called as objects and used like any other data you would otherwise read in and assign to an object manually. See the following example of a plot using primary.data::nobel.
library(tidyverse)
library(primer.data)

nobel |>
  group_by(born_country, year) |>
  summarize(prizes = n()) |>
  mutate(cum_prize = cumsum(prizes)) |>
  ungroup() |>
  filter(born_country %in% c("USA", "United Kingdom",
                             "Germany", "France",
                             "Poland", "Sweden",
                             "Japan")) |>
  mutate(born_country = factor(born_country, levels = c("USA", "United Kingdom",
                                                        "Germany", "France",
                                                        "Sweden", "Poland",
                                                        "Japan"))) |>

ggplot(., aes(x = year, y = cum_prize, color = factor(born_country))) +
  geom_line() +
  geom_vline(aes(xintercept = 1945), color = "darkgrey") +
  geom_text(aes(x = 1941,
                y = 100,
                label = "End of WW2"),
                color = "darkgrey",
                angle = 90,
                vjust = 1.2,
                size = 3) +
  scale_x_continuous(limits = c(1900, 2020),  expand = expand_scale(0, 1)) +
  labs(title = "Nobel Prizes Over Time by Origin of Laureate",
       subtitle = "Number of U.S. laureates has grown at higher pace since 1945",
       y = "Prizes (Cumulative)",
       x = "Year",
       color = "Country") +
  theme_light()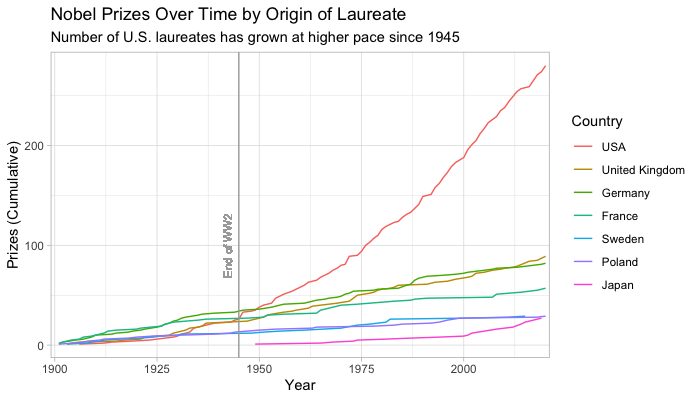
Citing primer.data
citation("primer.data")
#> To cite 'primer.data' in publications use:
#>
#>   Kane, D., & Weiss, T. (2021), 'primer.data'. R package version 0.7.0,
#>   <https://github.com/PPBDS/primer.data>.
#>
#> A BibTeX entry for LaTeX users is
#>
#>   @Manual{,
#>     title = {primer.data},
#>     year = {2021},
#>     url = {https://github.com/PPBDS/primer.data},
#>   }